

TUI viewer for sysstat (.sar) history, powered by sadf.
Reads every sysstat data file in a directory (e.g. /var/log/sysstat) via
sadf -j -- -A, in parallel, and lets you browse the last 30 days of CPU,
memory, disk, and network activity — drill from a day down to a single hour
without leaving the terminal.
- Cargo:
cargo install sysplot - Debian package: https://github.com/wabuntu/sysplot/tree/main/target/debian
- RPM package: https://github.com/wabuntu/sysplot/tree/main/target/release/rpmbuild/RPMS/x86_64
- Single binary: https://github.com/wabuntu/sysplot/tree/main/binaries
Requires sysstat to be installed (for sadf).
$ sysplot                          # defaults to /var/log/sysstat
$ sysplot /var/log/sysstat         # a directory of saXX/saYYYYMMDD files
$ sysplot /var/log/sysstat/sa15    # a single file
Navigation:
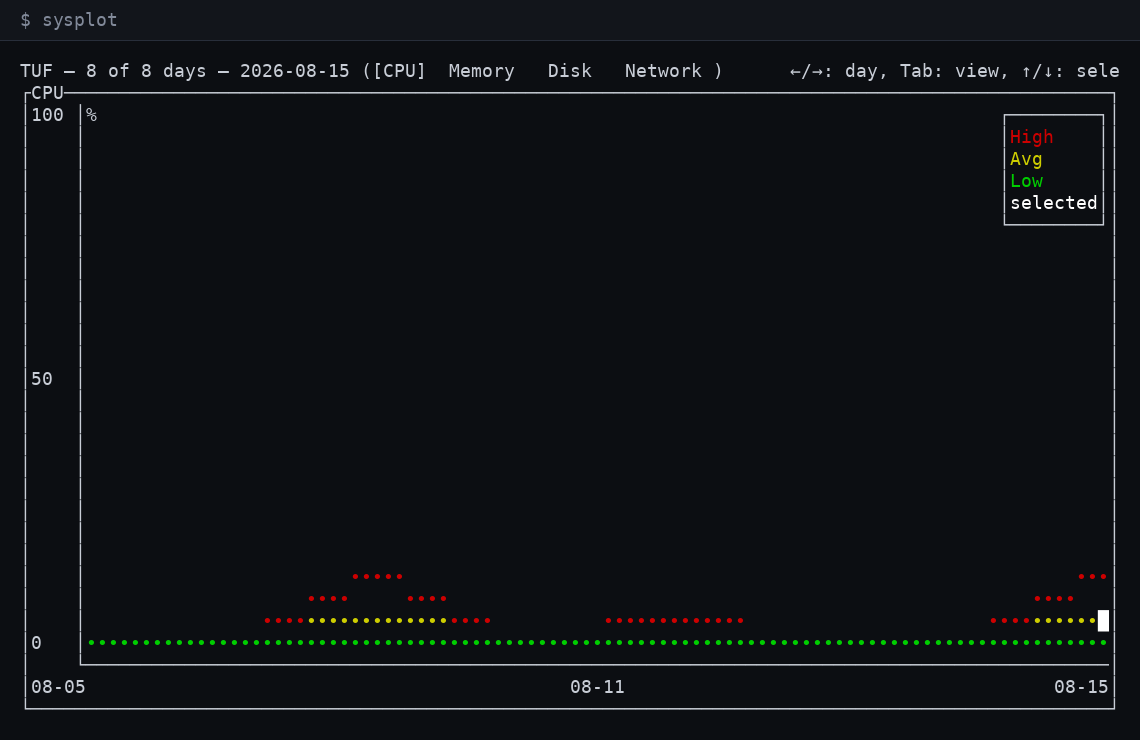
- Overview (the screen you land on) — CPU / Memory / Disk / Network,
one point per day across the whole loaded range, plotted as High/Avg/Low
lines.
←/→moves the day cursor (starts on the most recent day),Tab/Shift+Tabswitches metric,↑/↓cycles the selected disk device / network interface,Enteropens the day under the cursor. - Day view — same CPU/Memory/Disk/Network controls (
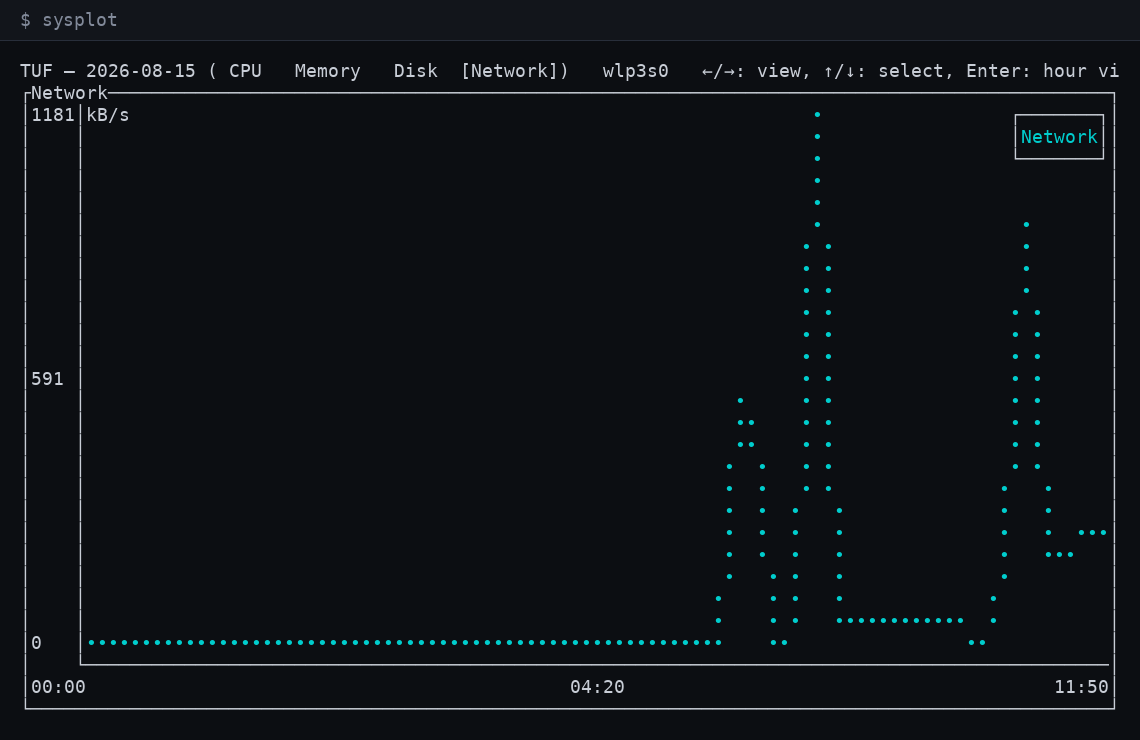
←/→now switches metric), zoomed to that day's raw samples.Enterlists the hours it has samples for;Escreturns to the Overview with the cursor right where you left it. - Hours — pick an hour from the list.
- Hour view — same controls again, zoomed to that hour's samples.
Esc goes back one level, q quits from anywhere.
Note: the finest resolution shown is whatever your sysstat collection interval actually is (commonly every 10 minutes) — drilling into an hour zooms into that hour's real samples, it doesn't invent per-minute data that was never collected.